Exploring Chart.js with Star Wars data
Chart.js is a popular JavaScript library for creating beautiful charts with JavaScript. In this post, we will have some fun with it by visualising Star Wars data.
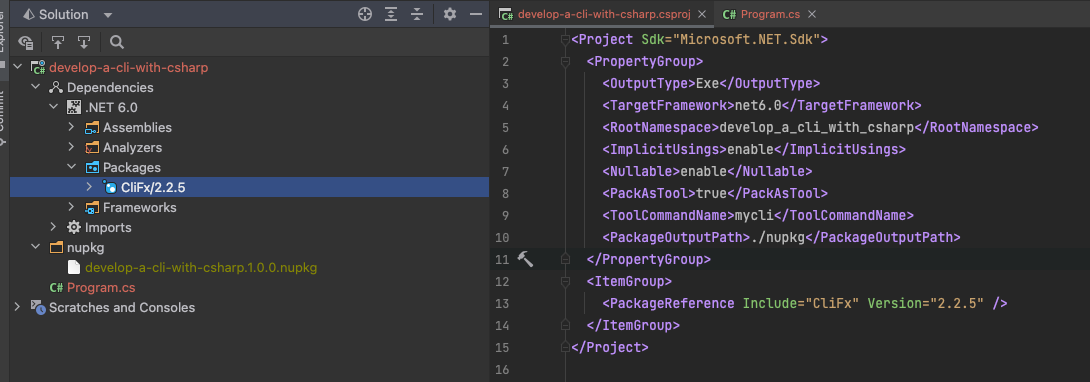
Installation
There are various methods to install the library.
When it’s used in a project, I’d recommend using NPM. It’s simple, and it doesn’t involve any external CDN dependencies. You can install it by running the following command:
npm i chart.js
Another way to use Chart.js is using a CDN. For example, you can use Cloudflare CDN:
<script src="https://cdnjs.cloudflare.com/ajax/libs/Chart.js/3.8.0/chart.min.js" integrity="sha512-sW/w8s4RWTdFFSduOTGtk4isV1+190E/GghVffMA9XczdJ2MDzSzLEubKAs5h0wzgSJOQTRYyaz73L3d6RtJSg==" crossorigin="anonymous" referrerpolicy="no-referrer"></script>
In the sample project, I set the responsive option to false so that the data is more visible. Otherwise, it uses the entire window, making it hard to see the whole chart.
Data Source
In this little project, our data will be coming from Star Wars API

It’s a free-to-use API that returns Star Wars-related data which can be fun to use in little projects such as this one.
Source Code
I will not include all the source code in this post as it becomes too lengthy. You can access the complete code here: Source code of the project.
Getting Started
Bar Chart
Let’s get started with a bar chart that shows the number of characters and species shown in each film:
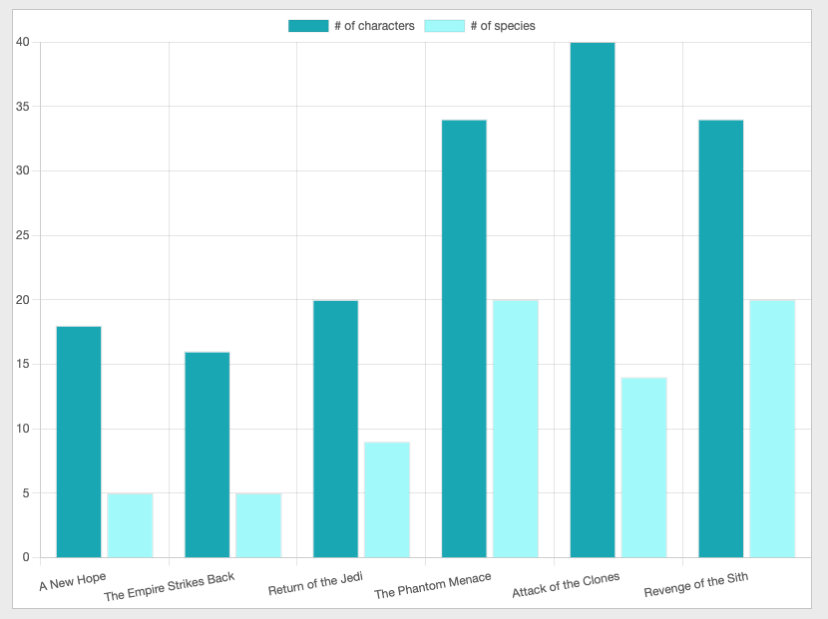
- In this example, we use dynamic data instead of a fixed array
// ...
data: {
labels: data.map(d => d.title),
datasets: [
// ...
- Chart.js doesn’t have built-in support to generate random colours automatically. So I used a function to return random colour values and called it for each member in the data array.
- The data we display on the Y-axis is specified in the data.datasets property. I only added two datasets in this example, but you can add as many as you like.
Line chart
The structure is very similar. The main change is to set the type property to the line.
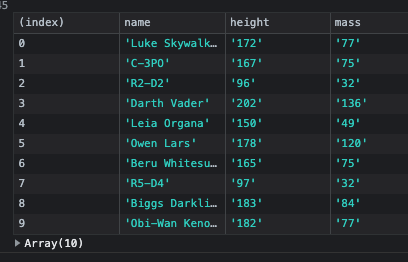
- In this example, I showed how to pass in object arrays rather than primitives as data.
// ...
data: data.map(d => ({ x: d.name, y: d.height })),
// ...
This way, I was able to specify the x and y-axis values in one statement.
- One note about responsiveness and how it handles data. The people endpoint returns 82 people, and in the image below, you can see all their heights:

If you disable responsiveness and draw the chart on a smaller canvas, it hides some labels and shows what it can that is still readable. I think this is a smart approach. There is no way to try to put 82 labels in a small space when none of them can be read.
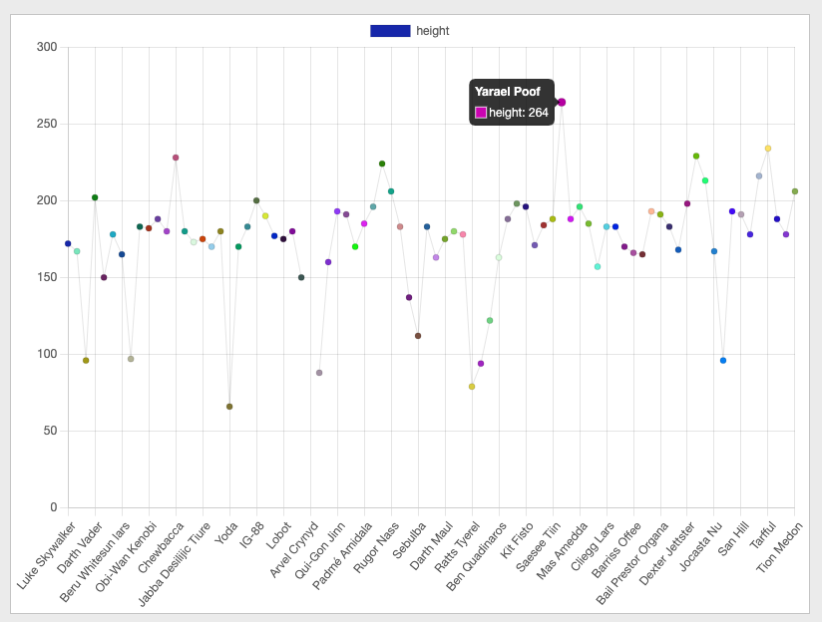
Also, if you hover over the data points on the chart, it shows the label and the value (by which we can learn Yarael Poof is the tallest person with 264 cm. and Yoda is the shortest with 66 cm.)
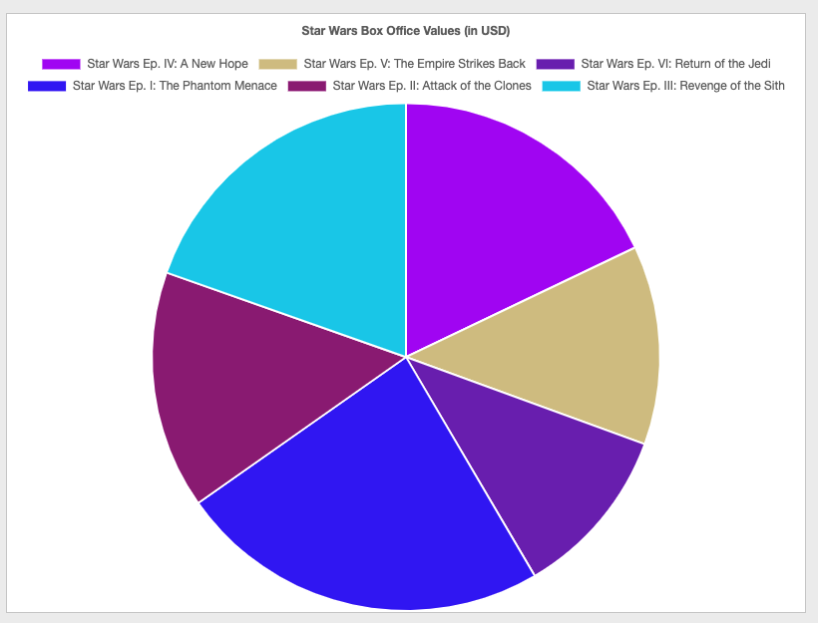
Pie and Doughnut Charts
These charts are good at visualising a percentage compared to the whole. Unfortunately, Star Wars API didn’t have box office data to show, so I gathered box office values from another site and displayed them in pie and doughnut charts:
Pie chart:
Doughnut chart:
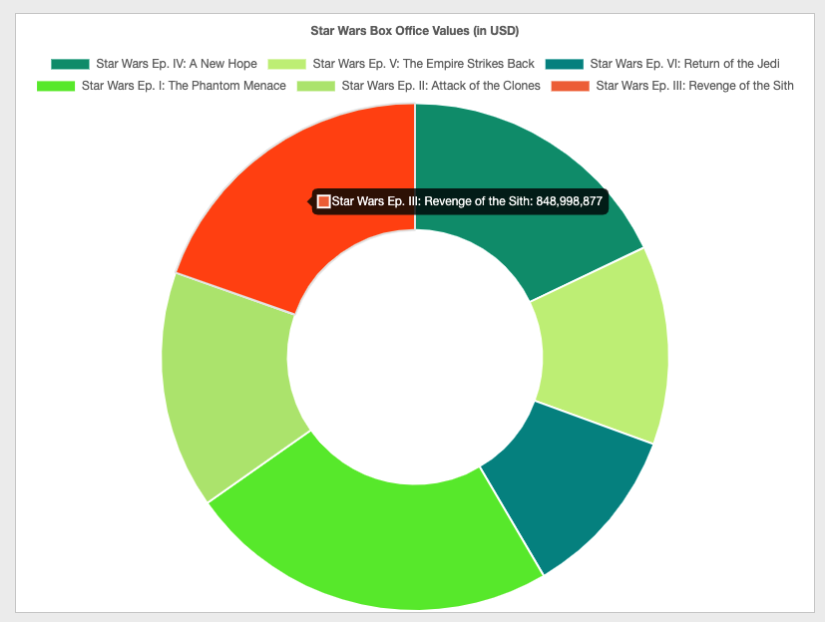
type: 'doughnut'
Both chart types are very similar. The only difference is the middle is empty in the doughnut chart. So the only difference code-wise was to change the type.
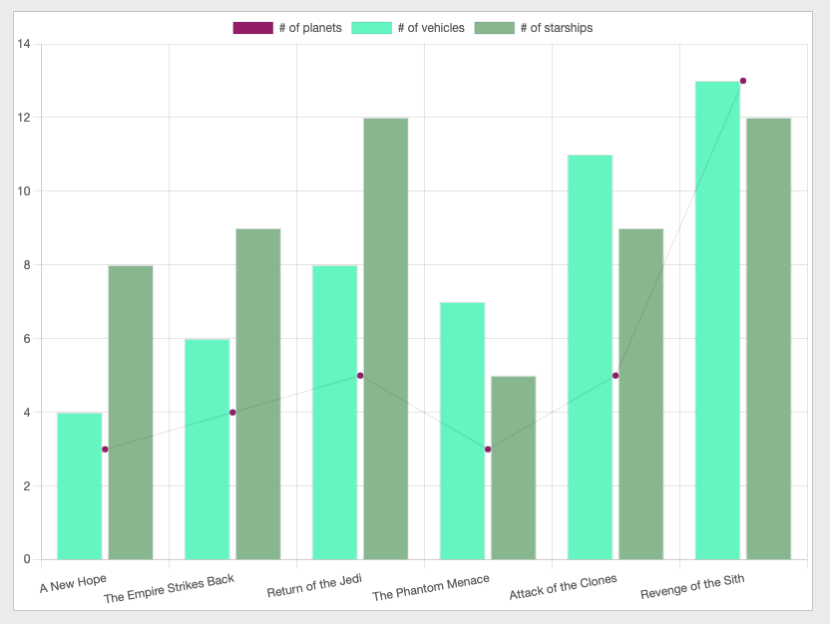
Mixed Charts
You can display different types in the same chart. The chart type for this type of chart needs to be a bar. It’s not very intuitive, but it’s how it works.
In the following example, I show the number of planets as a line chart, and the number of vehicles and starships as bar charts, all in the same visual:
Other Charts
In addition to the basic charts, Chart.js supports many other charts such as bubble charts, radar charts, scatter charts etc. I’d recommend checking the resources section for documentation and samples to see them in action.
Conclusion
This post covered how to install and use the Chart.Js library, which can be very useful in creating beautiful charts. We used Star Wars API to visualise Star Wars trivia to make the project even more fun!
I hope you found this post valuable and fun. Please let me know what you think in the comments below.