-->

dev excel

Spreadsheets are great tools. They are user interface and database combined in one application and have been infinitely helpful for ages. In this post, we are going to look into a handy NuGet package called ClosedXML to create and manipulate Excel spreadsheets by using a CLI demo application.

Demo Use Case

As the energy crisis is getting worse, electricity prices are skyrocketing everywhere. So I decided to create a spreadsheet to log daily electricity costs programmatically. This generally is possible if you have a Smart Meter and can get daily costs from your supplier. Either way, the main objective is to demonstrate using .NET and ClosedXML NuGet package.

The final spreadsheet will look like this:
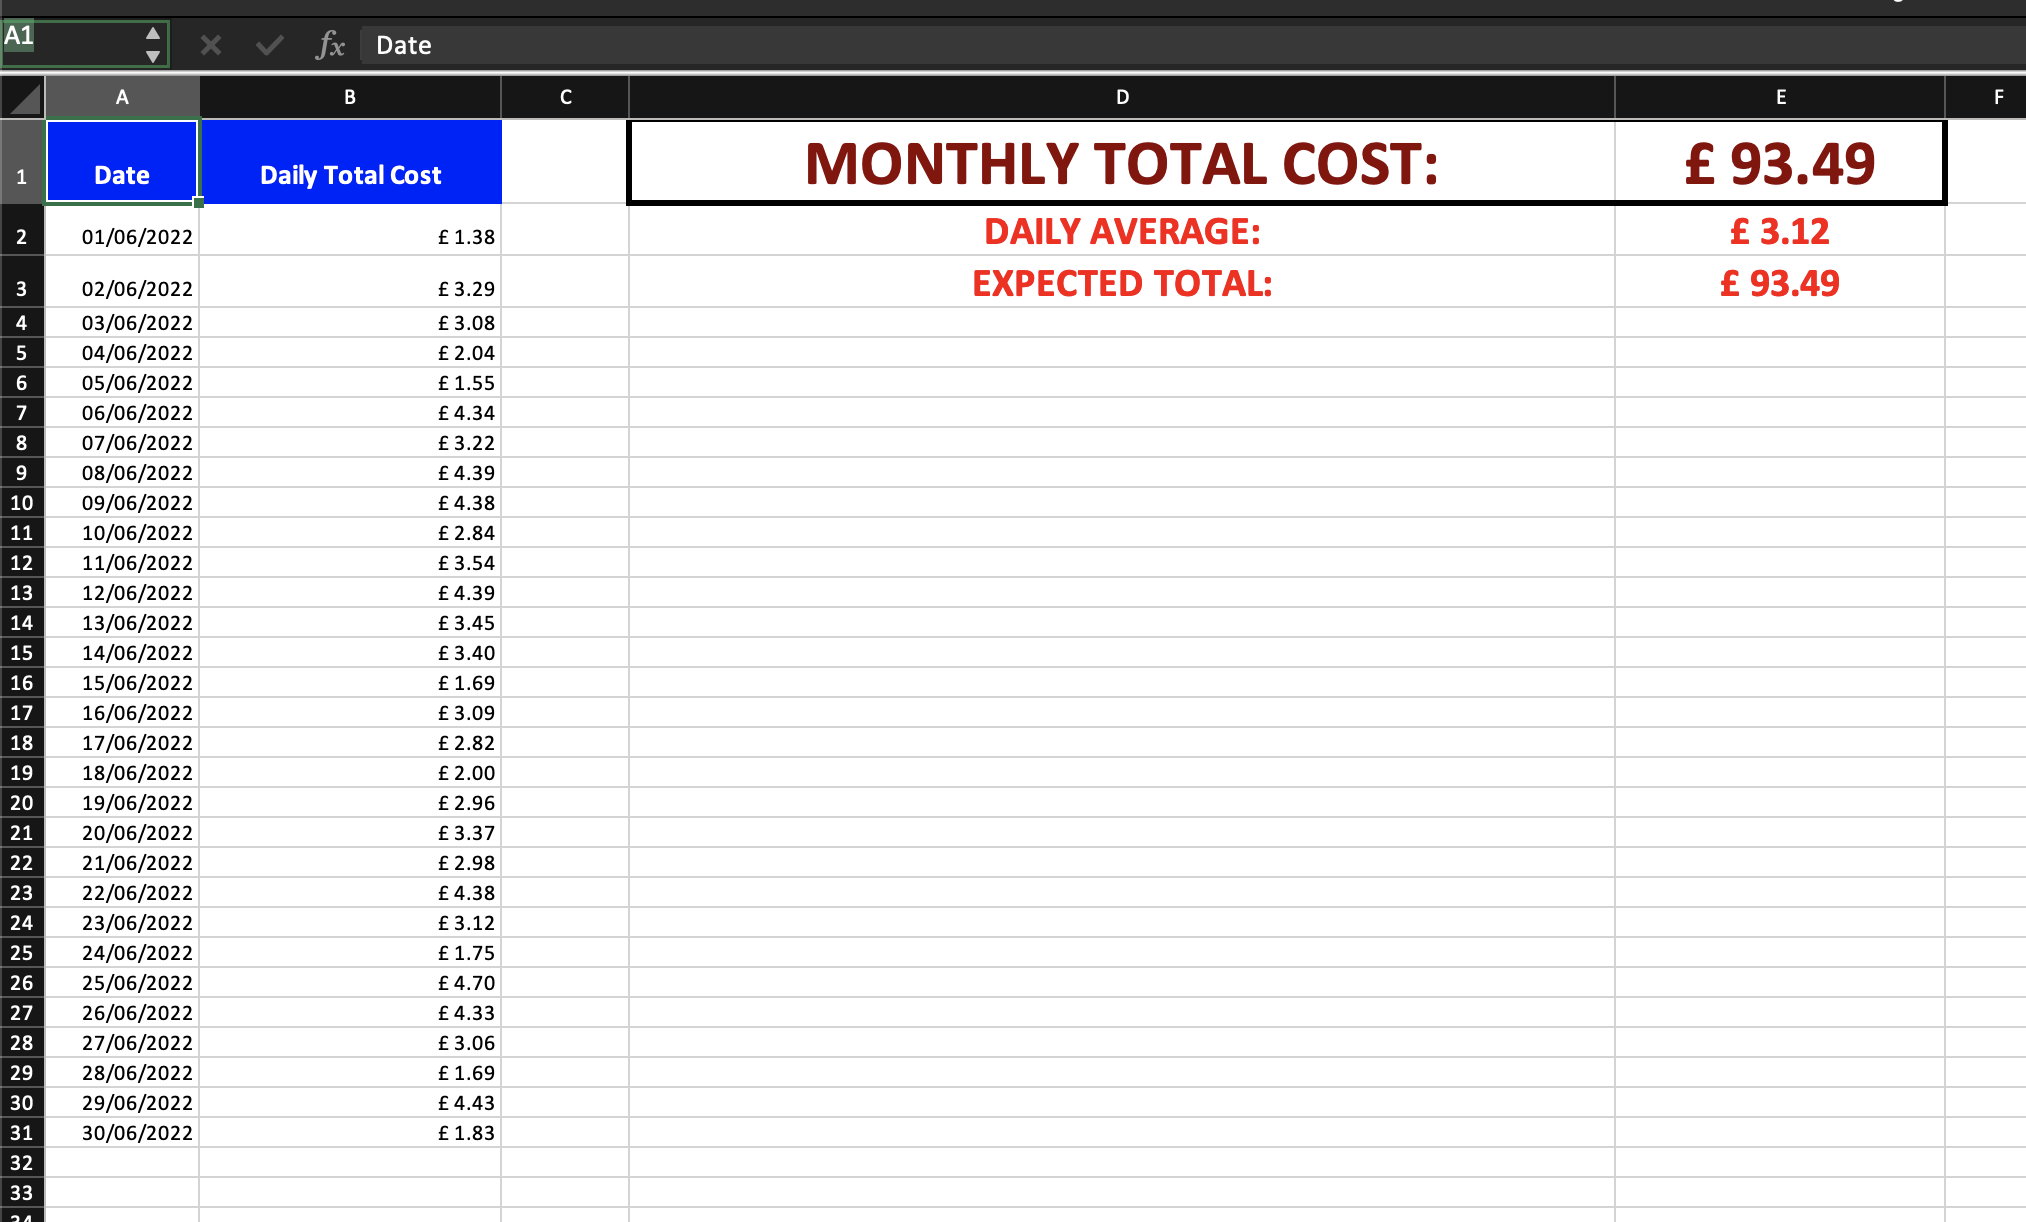
Spreadsheet showing daily electricity costs and monthly total cost

Usage

The project is a CLI project created using the dotnet tool and CliFx. You can also find the detailed blog post about creating your own CLIs published on this blog.

After you’ve cloned the repository, publish the application as a dotnet tool.

dotnet pack
dotnet tool install --global --add-source ./ElectricityCost.CLI/nupkg/ ElectricityCost.CLI

Then you can use it anywhere on your machine.

For example, to create a new spreadsheet from the built-in template, you can run this:

ec closedxml template new --path ElectricityCosts.xlsx

And you can add new costs by providing the day of the month and the cost value:

ec closedxml add --path ElectricityCosts.xlsx --day 2 --cost 3.44

Implementation: Using CloseXML - An easier alternative to OpenXML SDK

ClosedXML is a wrapper around OpenXML that makes Excel spreadsheet manipulation a breeze.

When working with a spreadsheet, you often want to address the cells by row and columns as you would typically do in a table and read/write data into it. ClosedXML allows us to do precisely that.

using ClosedXML.Excel;

using (var workbook = new XLWorkbook())
{
    var worksheet = workbook.Worksheets.Add("ClosedXMLDemo");
    worksheet.Cell("A1").Value = "Hello World!";
    workbook.SaveAs("Sample1.xlsx");
}

The code snippet above creates a new Excel file and saves it in the Sample.xlsx file. SaveAs might sound like it only handles existing files, but it is called to create new files.

Working on existing spreadsheets is also relatively straightforward. Pass the file’s path to the XLWorkbook constructor, and you can find the spreadsheet by a simple LINQ query.

using (var workbook = new XLWorkbook("Sample1.xlsx") )
{
    var worksheet = workbook.Worksheets.First(ws => ws.Name == "ClosedXMLDemo");
    Console.WriteLine(worksheet.Cell("A1").Value);
}

And setting formulas is also as simple as setting the value. The following snippet shows a formula to calculate the sum of daily costs:

worksheet.Cell("E1").FormulaA1 = $"=SUM(B2:B{numberOfDaysInCurrentMonth + 1})";

Managing the styles is also quite intuitive:

var rngSubTotals = rngTable.Range("D2:E3");
rngSubTotals.Style.Alignment.Horizontal = XLAlignmentHorizontalValues.Center;
rngSubTotals.Style.Font.Bold = true;
rngSubTotals.Style.Font.FontSize = 20;
rngSubTotals.Style.Font.FontColor = XLColor.Red;
rngSubTotals.Style.NumberFormat.Format = $"{CURRENCY_SYMBOL} #,##0.00";

For the sake of brevity, I’m not going to put all the code in this post. So, please visit the GitHub repo and play around with the code.

Conclusion

In this post, we looked into using a very intuitive and powerful NuGet package: ClosedXML. However, dealing with OpenXML directly can be overwhelming so having the ability to manipulate Excel spreadsheets with a straightforward tool is handy.

Resources

docker podcast, downloader

Versioning is an important and one of the rather tricky aspects of software development. Simply put, versioning assigns a unique number that identifies a specific package or release. This post will look into a popular versioning method called Semantic Versioning.

What is Semantic Versioning?

Semantic Versioning is a popular versioning scheme that mainly uses a three-part version number. The version number is in the following format (there are pre-release versions as well, which we will look into in detail later):

MAJOR.MINOR.PATCH

For example, if the version number is 2.3.54, the individual parts would mean:

  • 2: Major version
  • 3: Minor version
  • 54: Patch version

The rule of thumb when it comes to incrementing these numbers is:

Major version

The major version number is incremented when you make incompatible changes.

Examples:

  • You removed an entire public class from a NuGet package

  • You changed the parameters that the API endpoint accepts

Minor version

The minor version is incremented when you add new functionality in a backwards-compatible manner.

Examples:

  • You add a new endpoint to a public API

  • You add a new parameter to a method with a default value so that old consumer can still call the method without breaking it.

Patch version

The Patch version is incremented when making backwards-compatible fixes.

Examples:

  • You fixed a bug without making backwards-incompatible changes

Pre-releases

In addition to the major, minor and patch versions, we may want to use pre-release versions. This would indicate that the product is not finalized. Examples of pre-release versions:

2.0.0-alpha

2.0.0-alpha.1

2.0.0-beta

2.0.0-beta.1

2.0.0-beta.2

2.0.0-rc.1

All the examples above are pre-release versions and are ordered from the lowest precedence to the highest one.

Please note semantic versioning has no knowledge of the words “alpha”, “beta”, or “rc”. The comparison is purely made by alphabetical order for non-numeric versions.

Build metadata

In addition to all the release and pre-release versions, we can also use extra metadata by using a plus sign (+) as a separator. This part is not used in precedence calculations and has informational purposes only. The metadata that follows the plus sign can be a series of dot-separated identifier lists.

For example, a version number with build metadata could look like this:

2.1.5+20220531 // Append the date of the release

1.8-beta+sha.a4b5d6 // Append a hash value of the package

Refactoring

How about refactoring? It’s not a significant breaking change, and you don’t add new functionality. Also, it doesn’t count as bug fixes. It might help prevent bugs from being introduced in the future, but it doesn’t strictly count as fixing anything.

We can find the answer in the Semantic Versioning specs:

Patch version Z (x.y.Z x > 0) MUST be incremented if only backwards compatible bug fixes are introduced. A bug fix is defined as an internal change that fixes incorrect behavior.

So if you change the code for whatever reason, you must at least increment the patch version to maintain the uniqueness of the package/release.

Front-end Versioning

A common question and debated issue is how to version front-ends. The Semantic Versioning specification is all about “API changes”. API in this context can refer to a HTTP API or a package (NuGet, npm, Maven etc.).

Front-ends are consumed by end-users, and they are not consumed by other software.

By saying not consumed by other software, I’m not counting the web scrapers. When you develop a front-end page, you don’t make a contract with an external tool whose goal is to scrape data from your page. Most likely, it happens without your consent. Therefore, if you make a change in your markup that breaks web scrapers, it doesn’t constitute breaking change in an API.

Defining a “breaking change” in a front-end is not easy. For example, if you move functionality to another page, it might be seen as a breaking change as some users might fail to find the new location of the functionality. Does this mean that you should increment the major version? If you did, what would that mean to the end-users? They still need to use the application/website like before. When interacting with actual human users, version numbers don’t mean much.

Users don’t care about your versions

The only exception I can think of is a complete project overhaul. If everything changes so drastically, you may choose to refer to it as version 2.0 of your application.

Other than that, I’d argue the best way to handle changes in a user-facing application is by leveraging changelogs.

When a user logs in, you can display them a nice little pop-up and briefly explain the key things that changed. Some more complicated changes might need some interactive walkthroughs etc. The main point is, that a user doesn’t want to or need to know that you deployed 2.10.24 version of your application. So show them how it affects their experience and leave the technical details out.

Conclusion

Semantic Versioning is a very popular versioning scheme as it’s simple and flexible. Some aspects are debatable whether or not it should be used, such as front-end versioning, but this doesn’t mean that it does a good job most of the time. We also discussed how to handle versioning in user-facing applications.

Resources

dev javascript, chartjs

Chart.js is a popular JavaScript library for creating beautiful charts with JavaScript. In this post, we will have some fun with it by visualising Star Wars data.

Installation

There are various methods to install the library.

When it’s used in a project, I’d recommend using NPM. It’s simple, and it doesn’t involve any external CDN dependencies. You can install it by running the following command:

npm i chart.js

Another way to use Chart.js is using a CDN. For example, you can use Cloudflare CDN:

<script src="https://cdnjs.cloudflare.com/ajax/libs/Chart.js/3.8.0/chart.min.js" integrity="sha512-sW/w8s4RWTdFFSduOTGtk4isV1+190E/GghVffMA9XczdJ2MDzSzLEubKAs5h0wzgSJOQTRYyaz73L3d6RtJSg==" crossorigin="anonymous" referrerpolicy="no-referrer"></script>

In the sample project, I set the responsive option to false so that the data is more visible. Otherwise, it uses the entire window, making it hard to see the whole chart.

Data Source

In this little project, our data will be coming from Star Wars API

Webpage showing landing page of Star Wars API

It’s a free-to-use API that returns Star Wars-related data which can be fun to use in little projects such as this one.

Source Code

I will not include all the source code in this post as it becomes too lengthy. You can access the complete code here: Source code of the project.

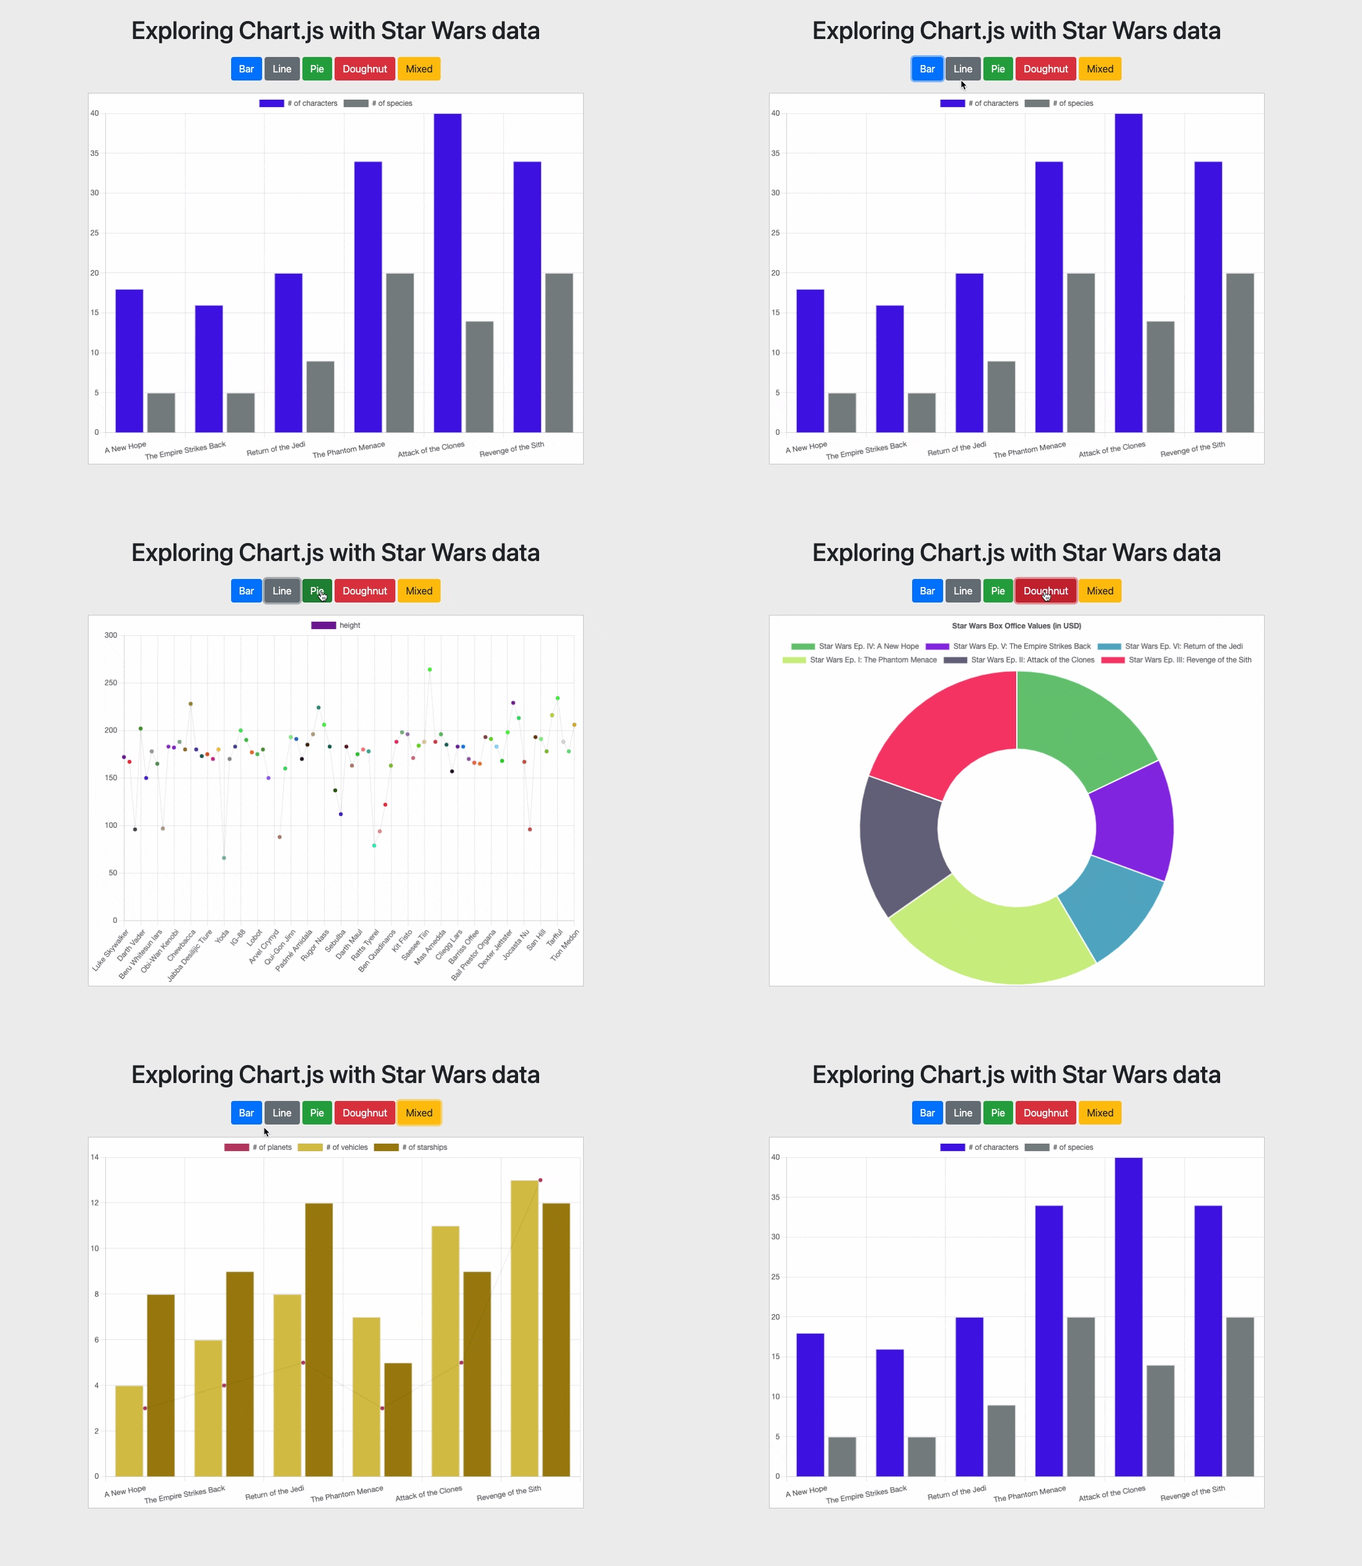
Animated GIF showing various chart types implemented in the sample application

Getting Started

Bar Chart

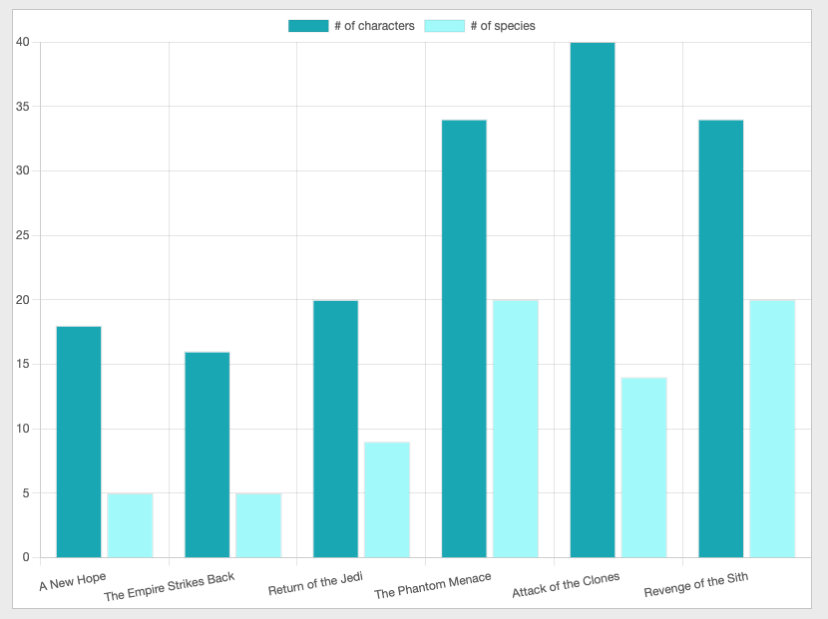
Let’s get started with a bar chart that shows the number of characters and species shown in each film:

Bar chart showing the number of characters and species in Star Wars movies

  • In this example, we use dynamic data instead of a fixed array
// ...
data: {
labels: data.map(d => d.title),
datasets: [
// ...
  • Chart.js doesn’t have built-in support to generate random colours automatically. So I used a function to return random colour values and called it for each member in the data array.
  • The data we display on the Y-axis is specified in the data.datasets property. I only added two datasets in this example, but you can add as many as you like.

Line chart

The structure is very similar. The main change is to set the type property to the line.

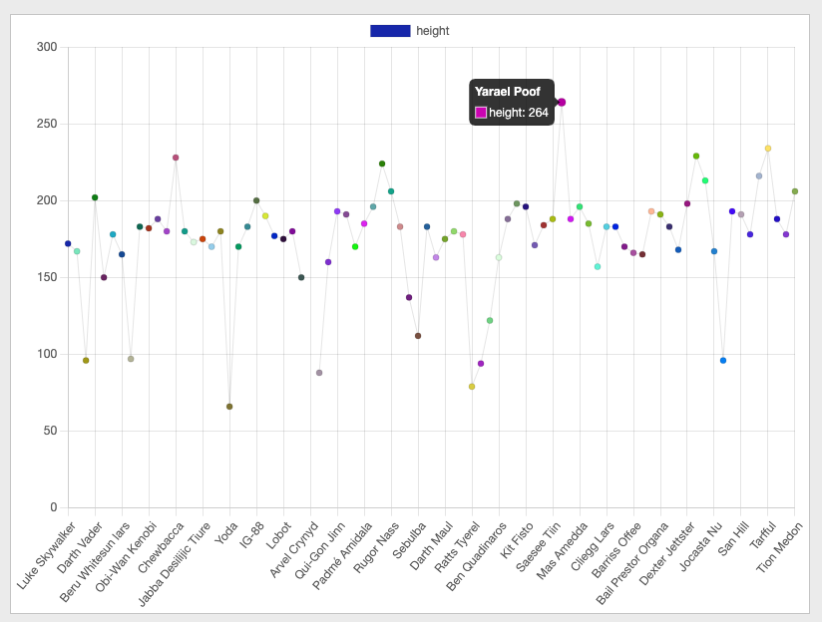
  • In this example, I showed how to pass in object arrays rather than primitives as data.
// ...
data: data.map(d => ({ x: d.name, y: d.height })),
// ...

This way, I was able to specify the x and y-axis values in one statement.

  • One note about responsiveness and how it handles data. The people endpoint returns 82 people, and in the image below, you can see all their heights:

Line chart showing the height of the characters in Star Wars movies

If you disable responsiveness and draw the chart on a smaller canvas, it hides some labels and shows what it can that is still readable. I think this is a smart approach. There is no way to try to put 82 labels in a small space when none of them can be read.

Line chart showing it's responsive and it will remove some labels when there is not enough space

Also, if you hover over the data points on the chart, it shows the label and the value (by which we can learn Yarael Poof is the tallest person with 264 cm. and Yoda is the shortest with 66 cm.)

Pie and Doughnut Charts

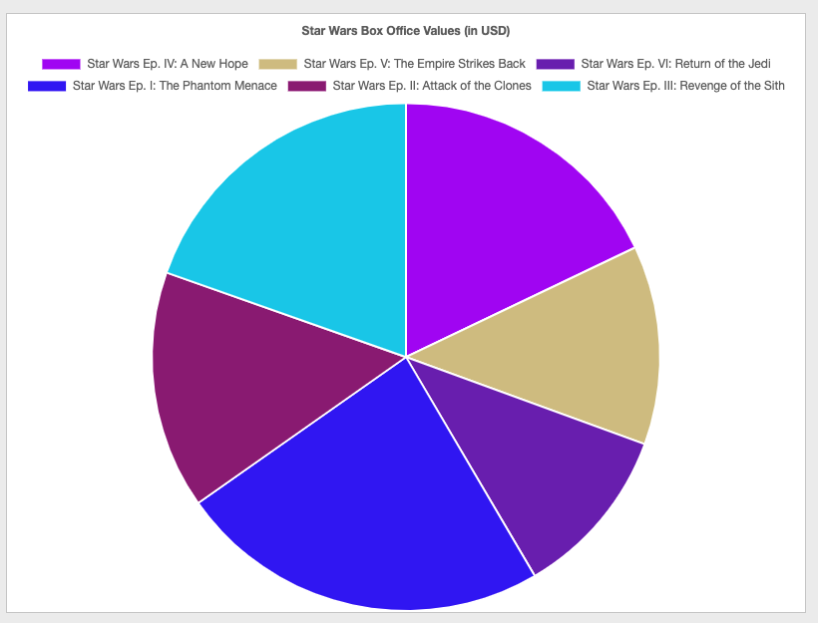
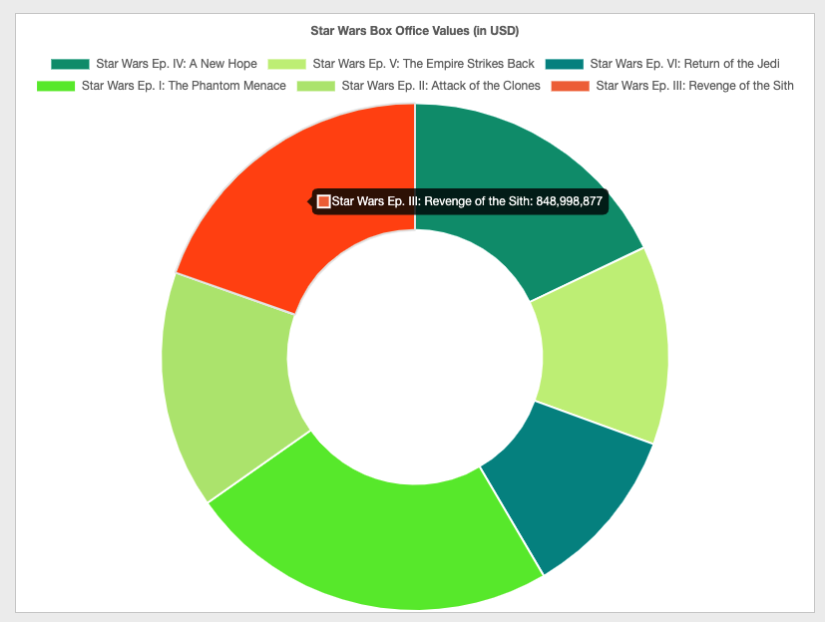
These charts are good at visualising a percentage compared to the whole. Unfortunately, Star Wars API didn’t have box office data to show, so I gathered box office values from another site and displayed them in pie and doughnut charts:

Pie chart:

Pie chart showing Star Wars box Office values in USD

Doughnut chart:

Doughnut chart showing Star Wars box Office values in USD

type: 'doughnut'

Both chart types are very similar. The only difference is the middle is empty in the doughnut chart. So the only difference code-wise was to change the type.

Mixed Charts

You can display different types in the same chart. The chart type for this type of chart needs to be a bar. It’s not very intuitive, but it’s how it works.

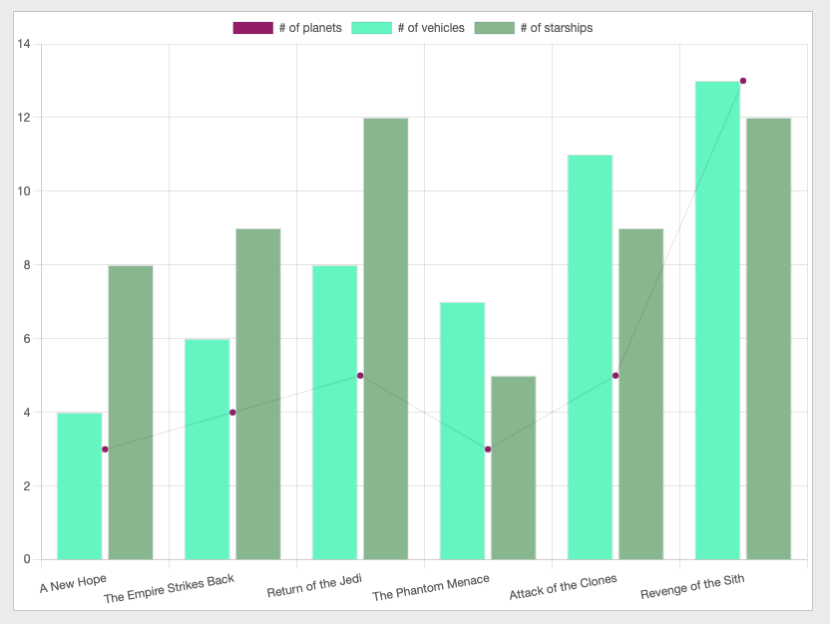
In the following example, I show the number of planets as a line chart, and the number of vehicles and starships as bar charts, all in the same visual:

Mixed chart showing the number of planets as a line chart, number of vehicles and starships as a bar chart

Other Charts

In addition to the basic charts, Chart.js supports many other charts such as bubble charts, radar charts, scatter charts etc. I’d recommend checking the resources section for documentation and samples to see them in action.

Conclusion

This post covered how to install and use the Chart.Js library, which can be very useful in creating beautiful charts. We used Star Wars API to visualise Star Wars trivia to make the project even more fun!

I hope you found this post valuable and fun. Please let me know what you think in the comments below.

Resources